
Get Out. The State wants this Property.
The elusive number of just how many people were evicted for the projects that destroyed cities.

Like Deja Vu Again
A news article today [Times Union, 9/26/25]:
County moves to evict widow for Micron project
Onondaga County is moving to evict a 91-year-old widow from her home in Clay, the same house the county promised she could live in for the rest of her life.”
At the Federal level and in the case of highways it is hard to beat a story regarding Frank Turner, chief engineer of the Interstate program [pg. 240, Tom Lewis, Divided Highways, Viking, 1997]:
“Turner visited his parents many times over the years, but none was more momentous than a visit in the early 1970s when he was federal highway administrator. On this trip he was confirming what maps in Washington had already told him: Interstate 35 through Fort Worth would take his parents' house. 'When I [Turner] arrived, I saw the stake for the centerline in front of the living room window.' Turner's mother greeted him at the door, asking, 'Frank, can't you do anything?' 'I can but I won't,' Turner replied. 'You'll just have to move.'”
It is also worth quoting an admission by Turner [Turner interview, Cullison Cady, Highways are for People, Highway User, August 1966, 14:16]: :
“Highways, you know, are for people. There is no reason for highways apart from people. Very simply highways are people. Those who think they are a broom to sweep people aside simply don't know highways or how we think about them.
“We have come to the point—really we have been there for quite some time—where—particularly with the Interstate System—the highway has met the city.”
And bulldozed it. Unlike some places now, at least the people were evicted before that happened.
In the 1970’s when strips of Troy, NY were being condemned and demolished by the State, there was a poster that could be purchased. It showed the finger of God pointing at Earth and it was captioned: “Earth, this is God. Get out. I have someone interested in the property.”
Hispanic man being removed from Los Angeles home. Image from Univ of Richmond, Renewing Inequality.
What Choice?
Limits to Mobility Part II has a section that attempts to count up just how much of America was told to “get out” after the Housing Act of 1949 and the Highway Act of 1956. There is no consolidated count, not in the Statistical Abstract of the U.S. or agency sites. It is not a number to be proud of.
In the 1970’s I made the direct observations of how a small city could be torn apart by the projects that used eminent domain to strip acres of land of people and businesses. That is what motivated writing Limits to Mobility (LTM). If you ignored just what was done by the State to wreck cities, you might fall for the belief that people just wanted to live, work and shop somewhere else. They also wanted automobiles once the rail transport system collapsed in favor of declining bus service.
LTM emphasizes that the formal change in the urban ecology occurred about 1920 and had long effects on all choices and unchosen acts like eviction. The 1970’s were just when collapse of private transit and many highway and “urban renewal” projects collided as in Troy. Throw in the gas crises (1973 and 1979) with radical inflation and you have all the urban and political pathologies we boggle about today. LTM insists that we look less at the symptoms and more at the deep causes.
I have no doubt that in the long decay of urban places that matured as transit-oriented development (TOD) many outmigrations favored the auto-oriented sprawl (AOS). Like rail transit, cities were caught in a financial spiral of less tax revenues to maintain a fixed plant of utilities and public services. Their hinterlands in contrast were mortgaging growth by growth. That was in part by the cross-subsidy of public utility extensions by the State and corporate utilities. I did a study on how State funds were being transferred out of the urban areas in the late 1970’s. But the suburbs could also bond for growth based on tax-revenue growth. That is just what I saw happening in Fairfax County, VA when I moved down to that growth suburb of DC in 1984.
This is all as spontaneous as sliding down the density gradient to cheaper land as the TOD form sprawled. But to call it “individual choice” is to mistake the formal change for the little and efficient decisions that adapted to the formal change. That fallacy has been examined here in several ways and generally as a Tragedy of the Commons (TOTC) [Hardin, 1968]. People do not “choose” the urban form, State projects or the decisions of people they elect to State power. We only choose within a form that offers the options and the rules of interaction. And by the 1970’s the rules for respecting urban development were off while the options were mostly “out there” beyond urban jurisdictions.
Pioneers
There is however always that thin boundary consisting of both the “early adopters” and the “stay behinds”. In the 1970’s we started talking about “urban pioneers”. The early-adopters got a car in, say, 1914 and moved to the hills while still commuting to where the money was, downtown. The stay-behinds were variously stuck in or loyal to their urban communities. We were already producing the demographic and political split between Blue/poor city and Red/rich suburb. The urban-pioneers, like me, were going in the unpopular direction from suburb to city again.
These were still “choices under the circumstances” but rarer than the general flow outward. It was choice versus the physics of diffusion. But within this mix were the cases where there was no choice at all. The State real estate agent knocked at the door, gave you the terms of condemnation and eviction (Get out!). Bulldozers followed. They gave minimal money compensation to property owners: Oh, we wrecked your real estate values as soon as we announced the highway, now we buy cheap. The urban form and tax base were steadily deteriorated and got no compensation. Oh, here is another project on which we dump scads of money and let the contractors run away with it. Contractors, give a little to the politicians if they get shirty. We lost enfranchisement.
The State could not valuate the public asset that should have been the object of State interest. As stated in a report [Relocation: Unequal treatment of people and businesses displaced by government, January, 1965, pp. 4-5] “just compensation” had not been interpreted to cover the costs of displacement:
“...the courts generally have held that owners and tenants have no constitutional right to compensation for such items as good will, business interruption, costs of moving personal property, loss of rentals due to anticipated taking, and other losses and damages which frequently are real and substantial.”
This is an issue of equity and accountability. There we4re some reforms after 1968 but the State still had no valuation of human suffering and hardship. Oh, wait, is that an ICE black-van I see?
Who is Accountable?
As the news article and ICE show, the use of eminent domain to evict and displace never ends. LTM focuses on the change in the urban ecology that displaced most small urban centers from their central commercial and social role. The question of accountability is clear if you trace how the formal change in urban access occurred through State action and inaction. That assertion is expanded in Urban Rail and Troy.
There are direct acts, that I call “efficient” because they correspond to efficient cause-effect and the cause cannot be denied. The eminent domain power of the State—that is its general sovereignty over subordinates and not just property condemnation—acts that way when it condemns a property. All accountable paper work. The compensation requirement ensures that the State owes up to what it did and pays. This is accountability as accounting which is why the economy works responsibly. It is not an accounting for the formal cause-effect of what happens to the city and the ecology.
The “State” as the entire governance hierarchy diffuses accountability. Both the Urban Renewal (aka slum clearance) program from the Housing Act of 1949 and the highway program as it became after the 1956 Highway Act are Federal programs propelled by dominant Federal money. The slum clearance was the forerunner of ICE, with poor “reasonable cause” for destroying neighborhoods but picking on minority tracts. Of course that was where the poverty and housing disinvestment was (by landlords). Trace that back and we get to the formal cause of urban decline. The cities stopped being the growing places because the access form changed to the AOS. I lived through the decades when all the smart people were arguing about what the problem was and what to do about it. The slum clearance attacked the symptoms as did highways and both were part of the problem.
I agree that throwing money at a problem you caused is inefficient and an affront to the taxpayer. But when the State did not care about the TOD—its productive money machine—that is what you get. And what is left over in the cores is just tsk-tsked by anyone not living there.
At the Federal level the integral urban problem was always split between housing/urban and transportation agencies. That was reinforced in the 1960’s when USDOT and HUD were formed. Despite a start on the housing side, transit projects went to USDOT. The direct property-taking actions were delegated to the several States for highways, and by States to subordinate agencies for “urban renewal”. In Troy, the Troy Urban Renewal Agency (TURA) was chartered to do the dirty work. Like the State highway agencies (SHAs), they were unelected and removed from any accountability (except for the financial accounting) once they got going.
The highway program was built on a revolving fund for property acquisition. The Fed was at a further remove from touching any private property and the property acquired along with the highway belonged to each SHA. As I like to say, the mission of the highway program was to demolish urban development to increases capacity for auto traffic where it did not fit. As I also reported in the post about Crossgates Mall, the confused excuse of one SHA engineer was “We only serve what people want”. And so “people” are accountable for bulldozing your house.
The Housing Act of 1949 was the apotheosis of New Deal concerns for urban housing. And it perverted those concerns about as much as possible. It had two heads. One was the racially-biased finance of suburban housing. The other was the racially-biased “slum clearance” of urban neighborhoods. Minorities were disproportionately displaced from their urban communities (and by highways too), excluded from those mortgages and left to occupy the highrise ghettos the State provided on the cleared urban land. Or the slums just moved.
How Many?
We are going to argue about the “how many” of eviction and outmigration but that is entangled in the “who is accountable” for the formal change from TOD to AOS versus the traceable paperwork. Was stripping so many people and social-economic form from cities critical to the urban pathology that was increasingly repulsive from the 1960’s? I repeat that the accountability is at formal scale going back to 1920. But every highway project and urban removal is a local critical point that could have preserved, or destroyed an urban ecology as surely as paving over a park or filling a wetland.
In Troy there were non-profit agencies devoted to helping victims of projects and saving neighborhoods. With the amount of money used by the projects they could have made Troy a better rather than worse place.
The University of Richmond has done an outstanding job of documenting the displacement of families by urban renewal 1950-1966. Their Map shows the numbers, location and ethnicity. But that is only part of the story of State evictions:
“A third of a million families is a stunning number, but it only represents a part of the toll that the "culture of clearance" took in mid-century cities (to borrow a phrase from historian Francesca Russello Ammon). It does not include numbers between 1967 and 1974 when those were not collected and published by the federal government. It does not include the massive number of single adults displaced—often vulnerable populations like gay men—who as single adults were not eligible for relocation assistance. It does not include displacements through [S]tate- rather than [F]ederally-funded projects. And it does not include displacements resulting from [F]ederally-funded interstate or public housing construction—programs related to but distinct from the urban renewal programs we map here.”
Getting the detail for each city is an amazing job of research. For highways the Federal Highway Administration (FHWA) should have compiled the figures. Yet because of the delegation of property condemnation the numbers were never part of their mandated accounting, although various compilations and statements exist.
When I was writing LTM only a variety of incomplete sources were found. There was an early statement by Turner [Letter from F.C. Turner, FHWA Administrator to Mr. Lee White, The White House, March 30, 1962 re 1962 Highway Act. Contains “Proposed Letter to the President...Draft 3/30/62. JFK Library, Digital Identifier: JFKWHSFLCW-017-009-p0001, Mass transit, 1962: 8 January-30 March]:
“...about 15,000 families and 1,500 businesses will be displaced each year in the next six to eight years by the completion of the Interstate highway system... the federally assisted urban renewal program...displaces around 30,000 families and 4,000 businesses annually.”
Extrapolating that over just eight years (probably the peak years), there would be a total of 360,000 families (housing units) and 44,000 business displaced. These are of course primarily urban. The report gives data and predictions of the “average displacement per year” of families and individuals displaced by the Federal and Federally-aided projects [pg. 129, citing 1964 Congressional report]. To summarize the major programs by past (from 1964) and future-projected:
Yearly Average: persons,families:
Highways: 32,395, 36,770
Housing/Urban Renewal: 34,033, 66,250
Then that is getting to 100,000 persons and families per year. Checking against other sources, the highway averages appear to apply close to 20 years past or future. The urban removal goes back to 1949 and the future rate to 1979 appears to be closer to 42,000 per year. Table 3 of the report gives detail on the UR acquisitions (not yet all relocated), families and individuals through September 30, 1965
White: 77,963
Non-White: 107,695
Unreported: 56,907
Businesses: 39,339
Another survey by the Commission added detail for the past year plus the next two (i.e., 1965-67) in 100 cities over 100,000 population:
Urban Renewal: 64,421 Families; 15,961 Business
Highways: 37,774 Families; 3,303 Business
Other programs: 61,780 Families; 2,583 Business
These numbers indicate that the pace was only picking up in the 1960s and that urban removal was concentrated in the larger cities, dominating street and highway dislocations.
There are not many independent sources to check the estimates against. For the total of dwelling units relocated, the best estimates I can produce are [see LTM Part II, pg. 523]:
For the Federal Highway Program, 1956-2014: 592,851 dwelling units and 1,615,400 persons.
For the Federal Highway Program, 1970-2014: est. 163,688 non-residential units
For Urban Removal, 1949-1979: 428,388 dwelling units, and possibly as many as a million persons.
Another recent source has been published in relation to the USDOT initiative to “reconnect communities” that were divided by highways [Past, Present, and Future of Reconnecting Communities, U.S. Department of Transportation, February 28, 2023]. The graphic admits to over 475,000 displaced households and a “majority” in “low income and minority urban communities”. The annual numbers peaked in 1964-67.
Nowadays you can Google. You get an AI answer: “Approximately 1.5 million households are displaced annually due to highway construction in the U.S.”. Wrong. It is often quoted that: “ USDOT estimates that more than 475,000 households and more than a million people were displaced throughout the country because of these highway expansions.” The AI probably took the total as “annual” which says something about AI.
My plot by year of the persons displaced by highways indicates that there was a steep slope up to most of the total by 1973 and only another 20% added by 2012. The cities we got are not the cities we had even in 1960. Did we “solve” poverty and deterioration?
So What?
Once the numbers are mixed over the whole sprawl area of the U.S. they disappear into a small number of “unfortunates” sacrificed for the State projects. What we got in return is another matter that is even harder to document or evaluate.
As far as compassion for the numbers, the current number of homeless people is about that of the total project displacees. We throw up our hands about that problem about the same way we regret the number of urban-housing units that the projects destroyed. Relating past destruction and current homelessness will of course raise hackles about efficient cause but those numbers point back to what we did to the TOD form. The Federal response escalates to sending in the troops, and ICE. We are cranking up the unaccountable cause-symptom-attack cycle. Just what an autocratic State wants to juice-up the urban-suburban polarity.
The “so what” has to be formal. Look at what happens to the functioning of any urban center when the projects rolled through. The University of Richmond study provides individual-city data for the urban removal part. I know the project-accountable numbers for Troy hardly tell the whole story. I have a map of Census tract losses for Troy in Urban Rail and Troy that indicated 2260 housing units lost in the 1960's and '70s from all causes, and 750 in the 1960's from highway and UR programs. Total Troy population drifted down from 72,000 in 1950 to under 57,000 in 1980 and hovers around 50,000 now. Growth of course went from where the highways demolished cities to where they reach green space and pave that over.
Troy is a microcosm of that because there has been some growth in outlying tracts masking the downtown that was nearly decimated. There is no doubt the projects destroyed the central business district (CBD) function in the 1970’s. It is nostalgic to look back on the vibrant downtown, with trolleys, before 1920.
The Troy case just illustrates the general diffusion in the AOS from the old centers to their periphery. The nearly-complete depletion of the commercial core for the suburban plazas and malls, at the access created by the Interstates and arterials, is discussed in previous posts. I saw a lively downtown and neighborhoods being decimated between 1966 and 1975.
The direct project condemnations are just the core of a rotten apple that extends from them. The direct demolition of neighborhoods by the Hoosick Street Bridge (I-787) only tells part of the story of the urban damage. The SHA highway plans for the 1956 program were launched by the 1944 Highway Act. In our region the Albany plans were published in 1950 and for Troy in 1954. Right away anyone with the means to move could see where they would be evicted or be near a new highway right of way (ROW).
I was direct witness to the decline of the ROW for Troy’s North-South Arterial as fine rowhouses became student rentals. Then the ROW was demolished 1968-69 for the highway that was never built. The Hoosick Street corridor similarly started a decline from continuous neighborhood to the barrier created by the Bridge and its traffic. The downtown lost its main customer base and the most unfortunate populations were shoved north into a new slum area of high crime, now called “North Central”. The projects mentioned were right through the Census center of black population in Troy although Troy was a case of mostly white low-income tenants.
From the Troy Census data perhaps half the dwelling unit losses around the core were from projects. The rest is eviction by lack of investment as a housing-decline push with the suburban pull. The disappearance of urban investment, whether in rail transit or urban locations, is the direct indicator of the collapse of the TOD form. That is the cutting of the feedbacks between rail transport and location, indicated by the rail peak about 1920. That is what Urban Rail and Troy is about, and the State is accountable far beyond its deliberate projects that only grew in the AOS and inevitably were anti-TOD.
The urban pioneers came back to the remaining rowhouses, as I did in 1971. That just started the fights against projects that were discouraging any such urban revival on top of the decades of damage already done.
As Jane Jacobs argued, the decline of the TOD at least thinned the “congestion” of the once-central places. Rents—the value of space according to access—dropped. In 1972 I could buy a three-story rowhouse, for my family plus one rental unit ($11,500) where previously there had been 5 units total, plus a store in the lower level of the high-stooped house. Modernization was needed but the basic structure could not be duplicated today. Where this works—like Georgetown or Beacon Hill—the persistent rent value is clear. Take away the access centrality, as in Troy, and then assail neighborhood quality on all sides, and less happens. Rowhouses available for $10,000 in the early 1970’s will go north of $400,000 now. But so few intact blocks are left. My current trolley-suburb, wood-frame house is a similar story.
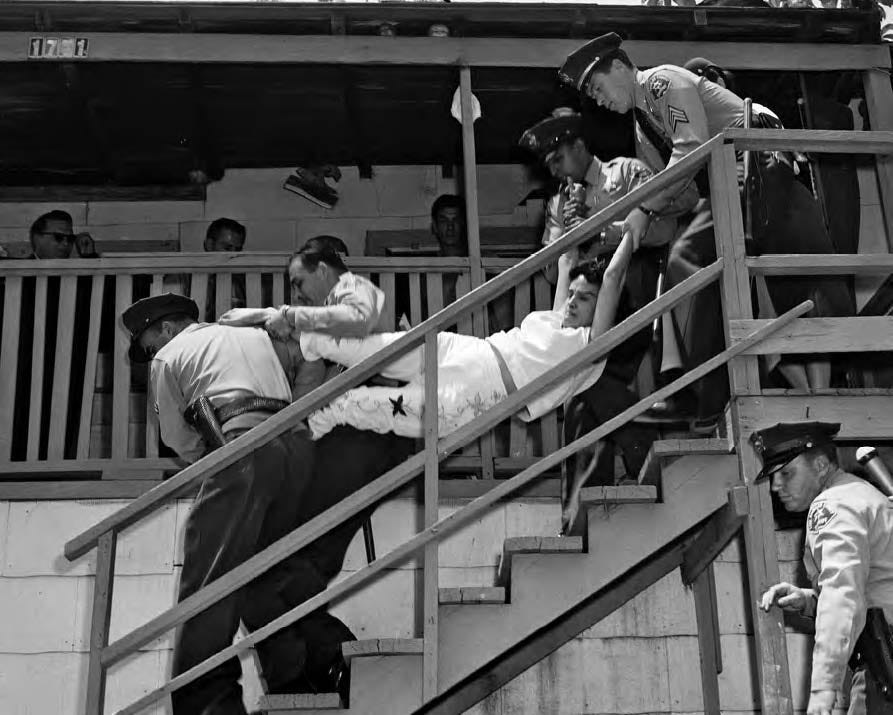
The direct evictions are just cruel and sudden. The North-South Arterial ROW was able to pre-decimate the strip that met the Bridge ROW. To the south was where Italian immigrants had established their stubbornly resistant neighborhood. When they were strong-armed by the SHA real-estate agents, the United Urban Ministries was formed ca. 1968 to assist the residents. That coincided with some reforms in the relocation program. But before that…see the picture above. It was like ICE.
The argument about the accountability for urban depopulation and decay may go on. There is no doubt in my mind that the critical change was the neglect of rail and the transfer of urban finance to rural highways that the State was responsible for in 1920.
Once the State conquers space (eminent domain as manifest destiny) for “our” urban ecology it has no competence to say how that develops. What had developed by 1893-1920 was the mature TOD form of local and financial accountability. It is what emerged from market-democracy. There were negative “externalities” of that rising to State responsibility. But those are the regulatory sin of omission by the State as discussed previously.
By the twin failures of what was not regulated but actively financed by the State we get the urban form that invited projects of demolition and construction in the latter 20th century. Each eviction, each human cost is a mark of human and governance failure by our State.